Work: one full study, two maps and an open-source tool
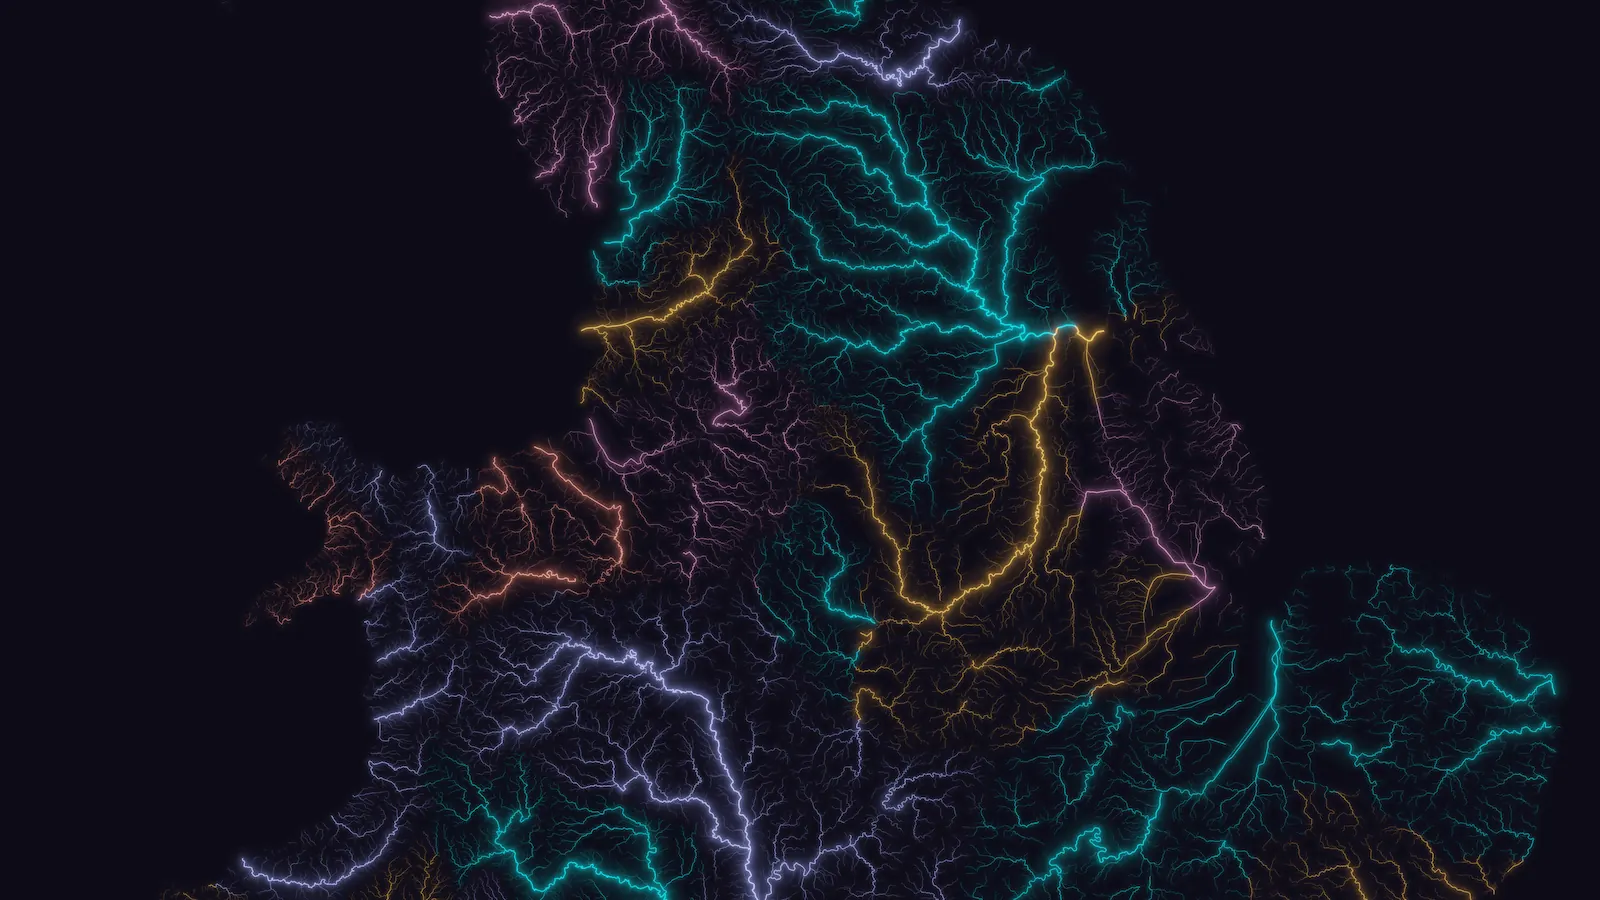
Britain's rivers, drawn for this site. Data: OS Open Rivers
The study and both maps name their data sources and what made them, and the code for OKF-Loom is public, so you can check what you're looking at. I'll only add client work with the client's permission.
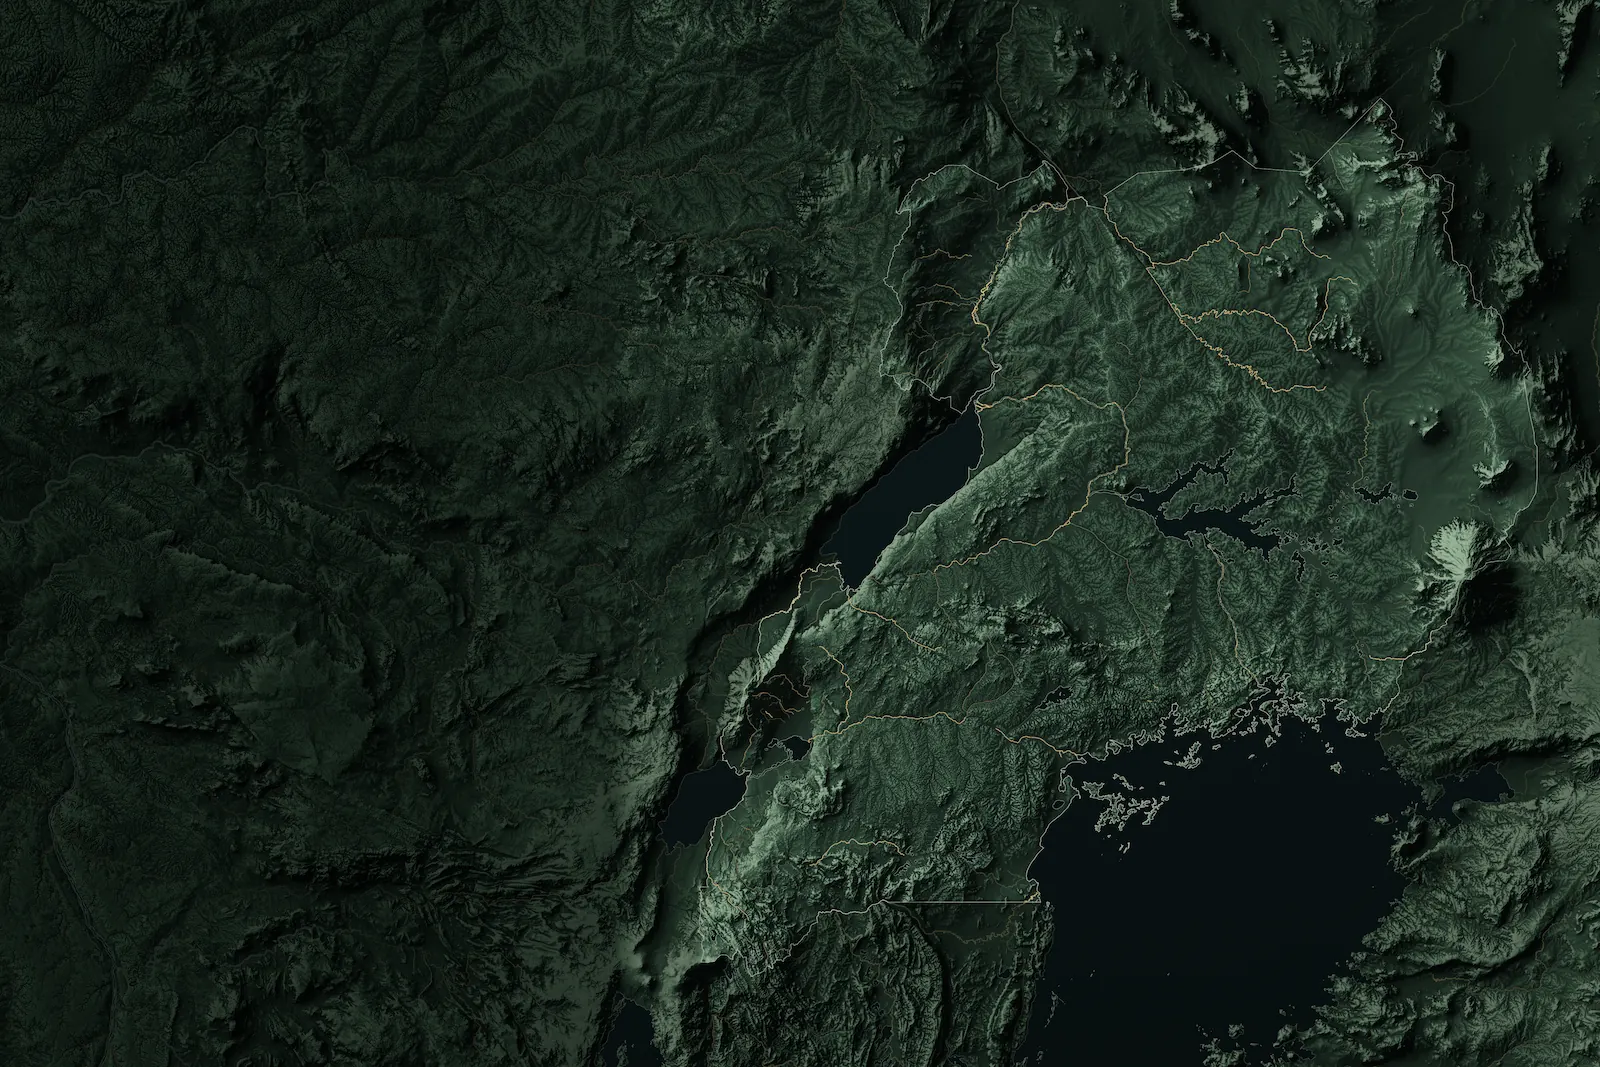
Uganda's terrain, drawn for this site. Data: Copernicus, OpenStreetMap
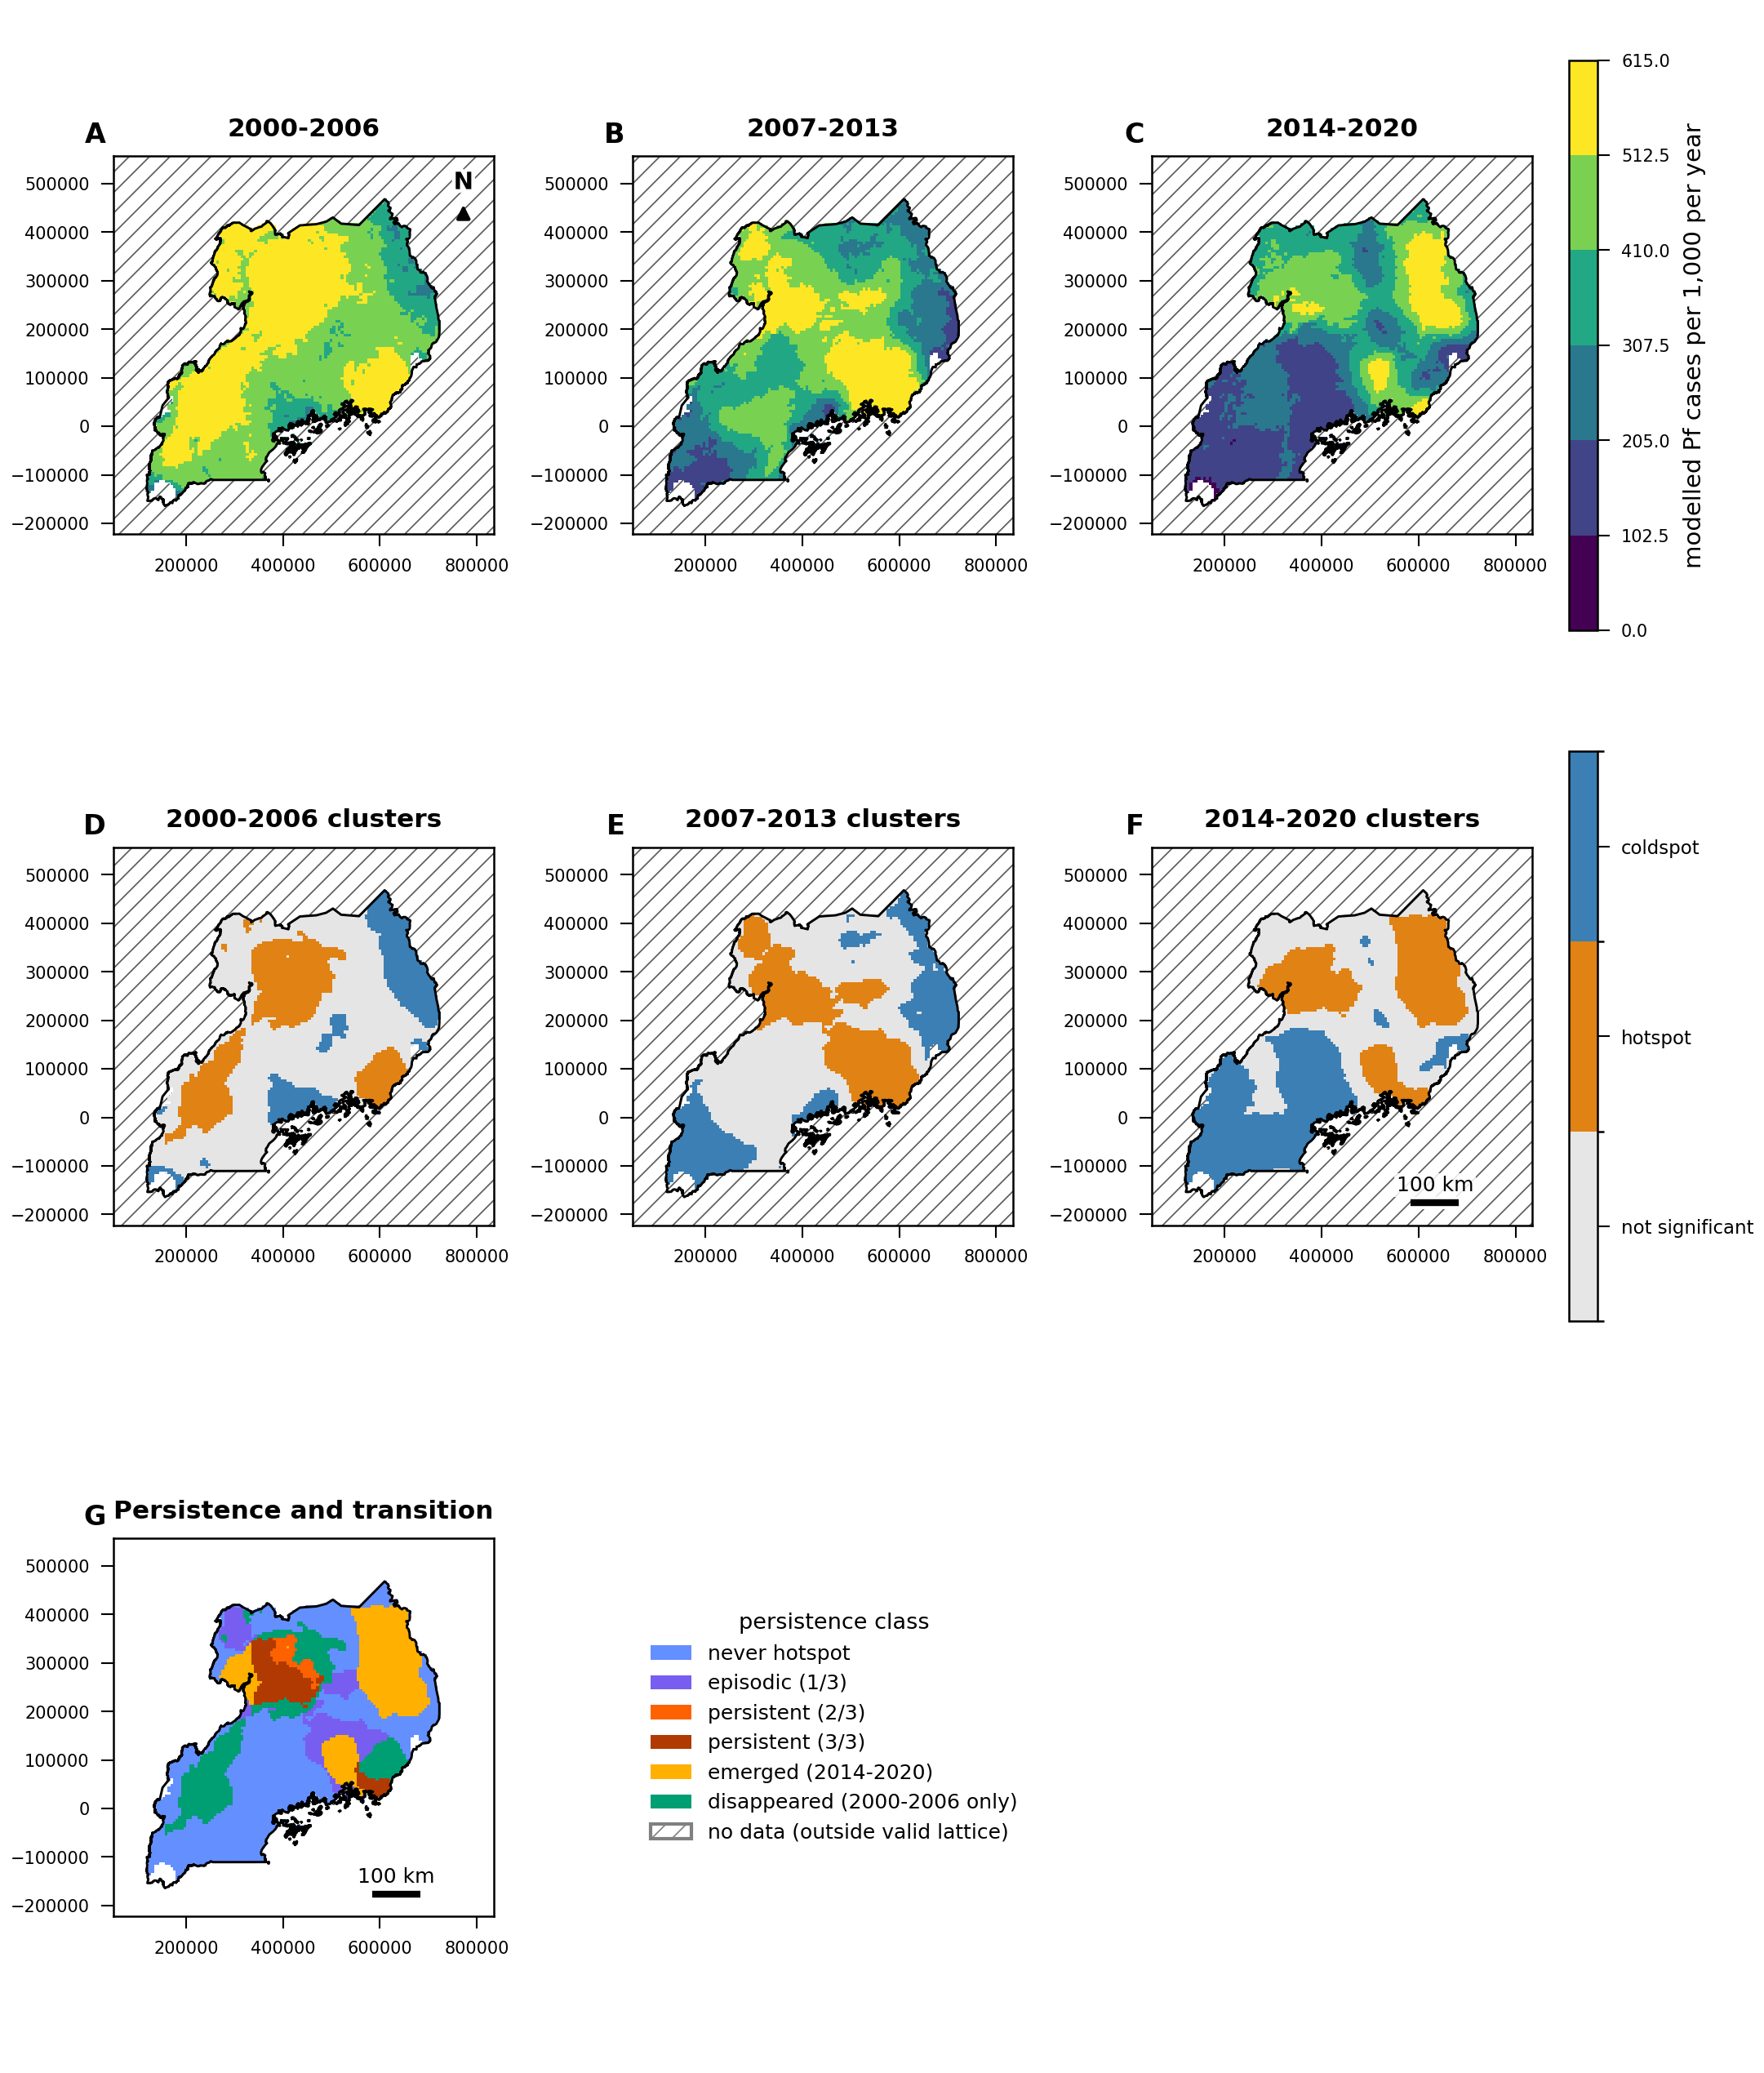
Uganda malaria study, 2000 to 2020
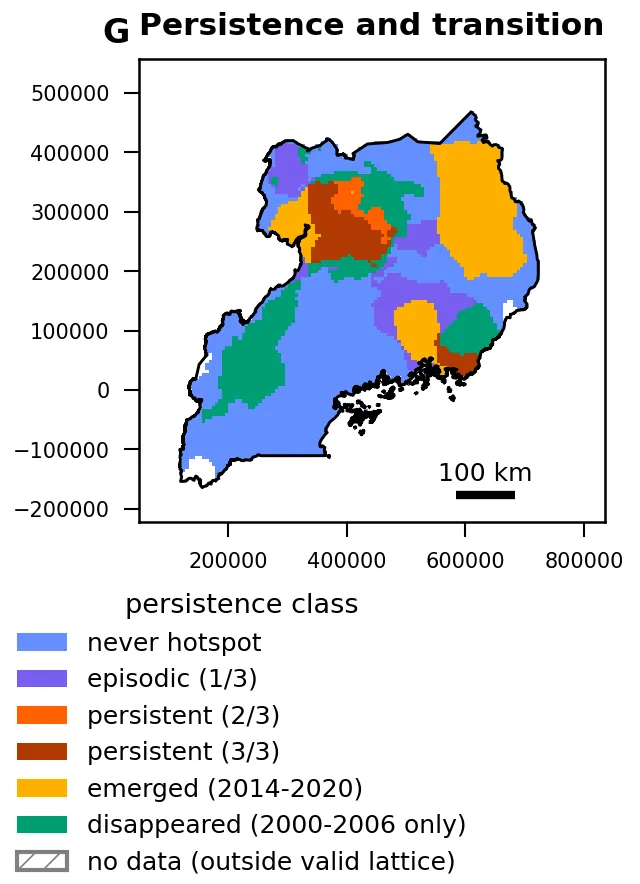
This is a 26-page study of modelled malaria incidence across Uganda, run end to end by ATLAS, Spatial Nexus's AI research system, and released on 13 October 2026. It found modelled incidence going from 503.7 to 260.1 per 1,000 people a year, but the reconstructed totals did not follow it down, and persistent hotspots are concentrated in the Eastern and Northern regions.
Where hotspots of modelled incidence persisted, emerged or disappeared, 2000 to 2020. Persistent means a hotspot in at least two of the three periods.Run end to end by ATLAS, Spatial Nexus's AI research system.Data: Malaria Atlas Project, P. falciparum incidence, release 202608, CC BY 3.0; boundaries from geoBoundaries, 2017 (ODbL 1.0). Analysis and figure by Spatial Nexus, adapted from these data.View the full figure (7 panels)
These two maps come from the #30DayMapChallenge in November 2026, and both were made by Moxi, Spatial Nexus's cartographer, with ATLAS. Each one leads with a single measured finding and says how it was measured.
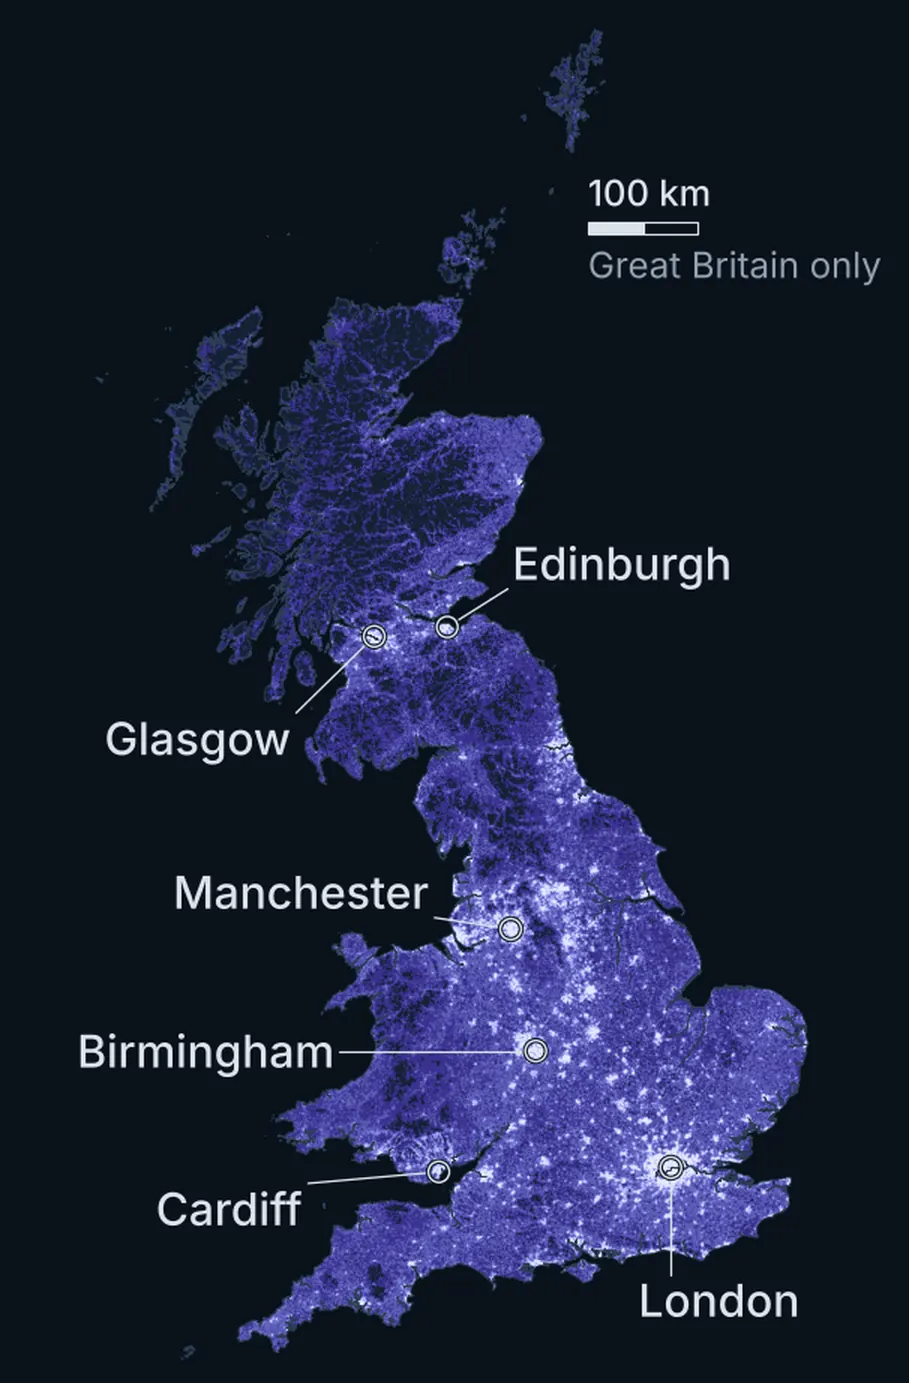
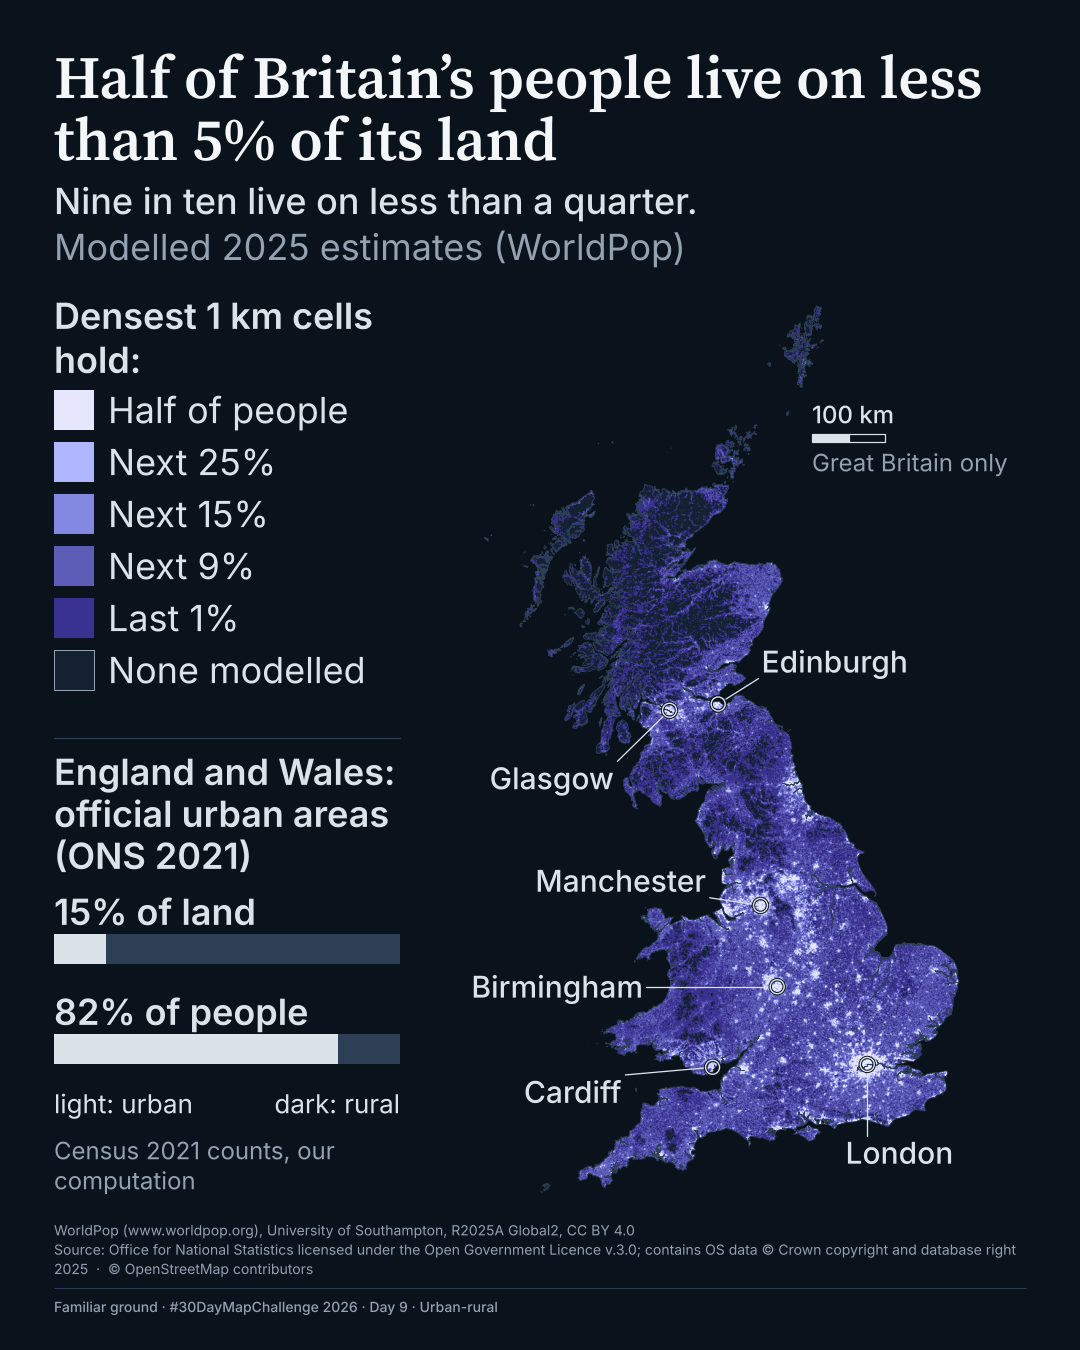
Half of Britain's people live on less than 5% of its land
The densest squares, which together hold half the people, cover less than 5% of the land, and nine in ten people live on less than a quarter of it. #30DayMapChallenge 2026, Day 9.
Every 1 km square in Great Britain is shaded by its modelled 2025 population, from the brightest violet (the densest squares, which together hold the first half of the people) to the darkest. Both statements hold under each of the six ways of counting land and grid size that were tested.
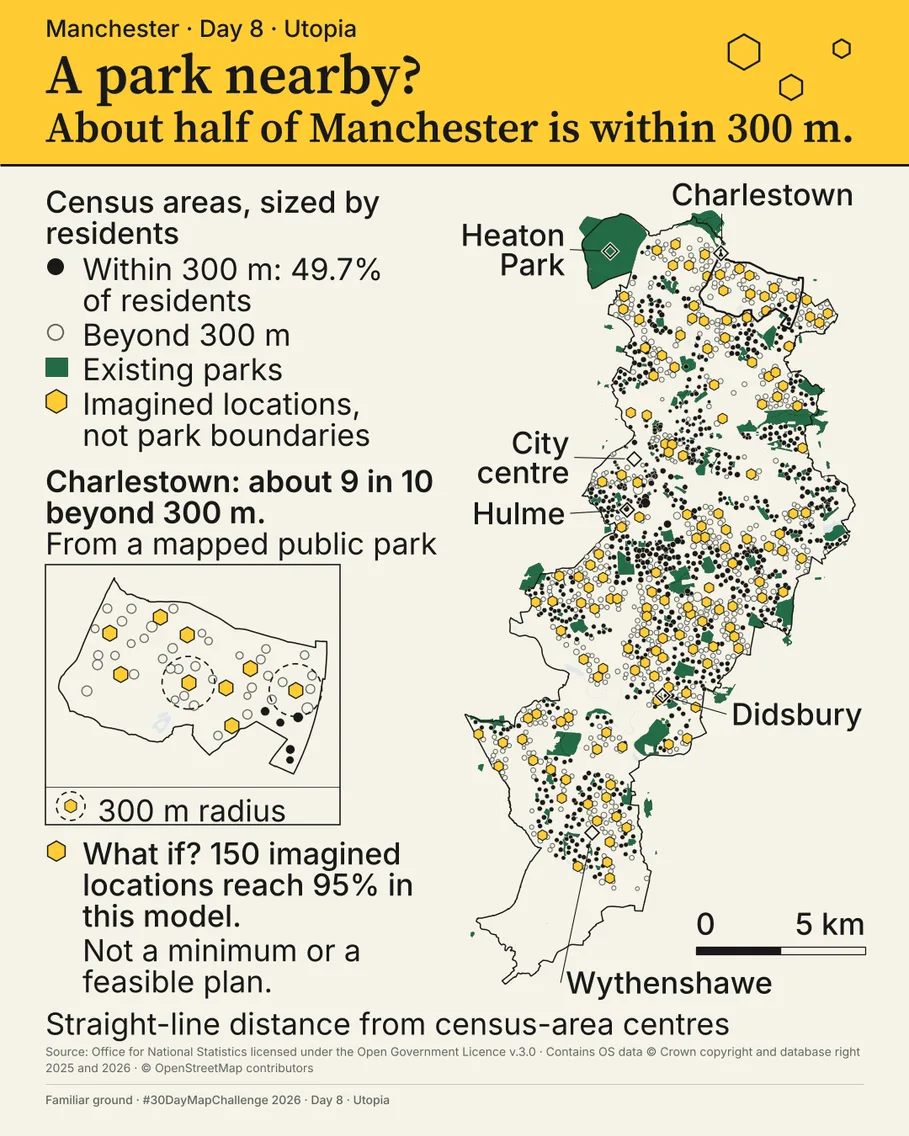
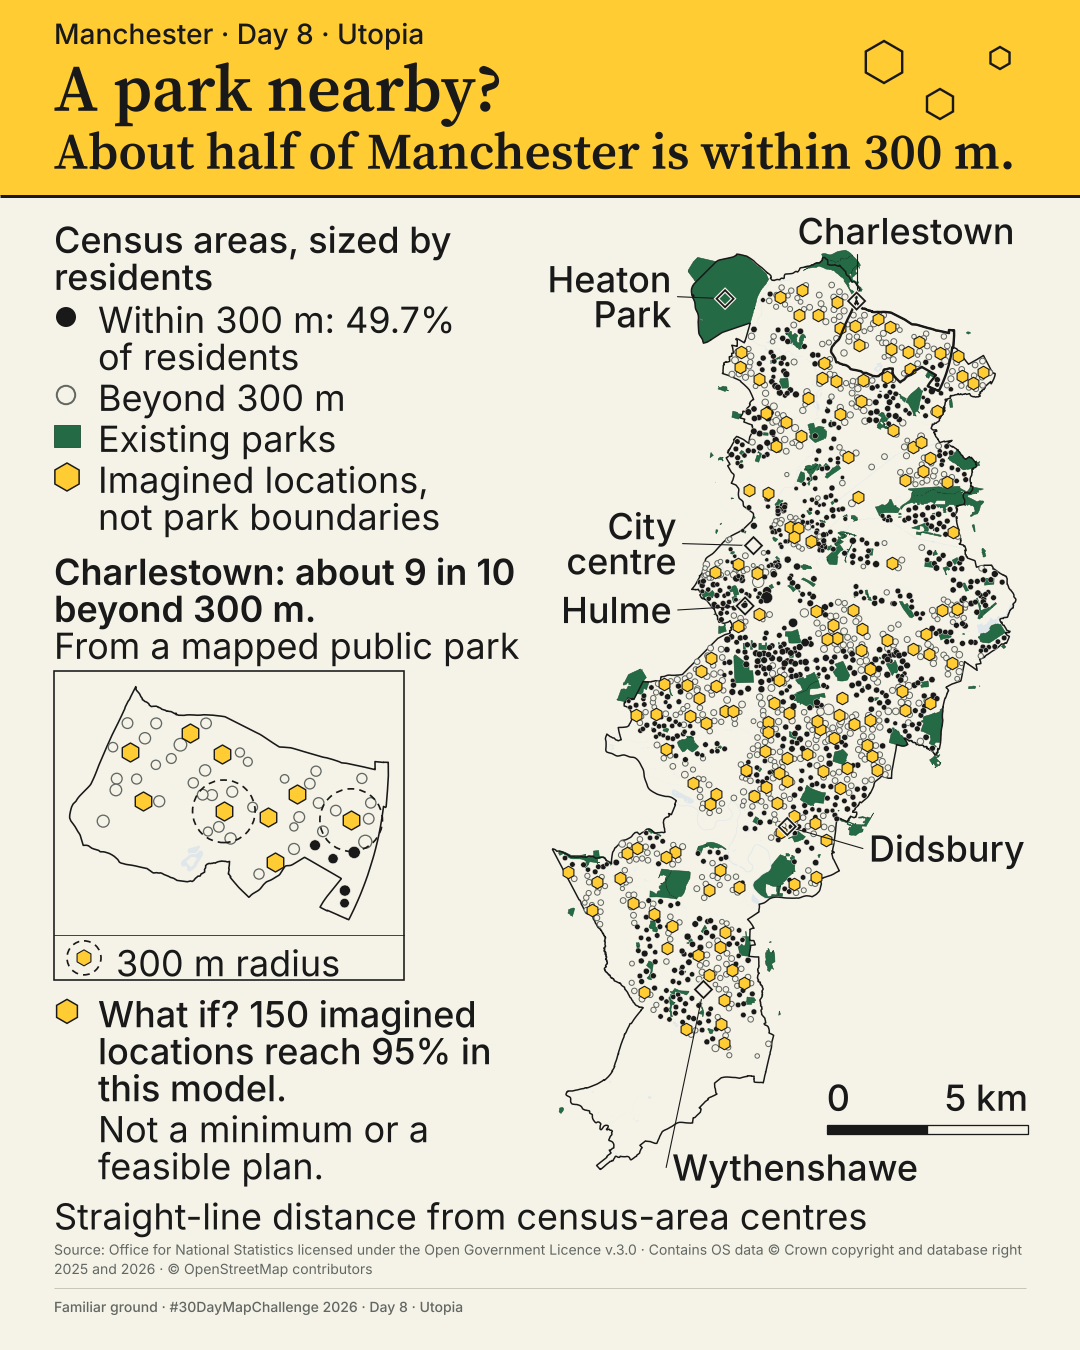
About half of Manchester lives within 300 m of a park
On a straight-line measure, 49.7% of Manchester's residents live within 300 m of a way into a mapped public park; five other ways of counting give between 37.1% and 66.5%. Rings mark imagined park locations, not a plan. #30DayMapChallenge 2026, Day 8.
Each census area in Manchester is a dot sized by its residents, and it's marked as within 300 m of a way into a mapped public park or farther away. The distance is measured in a straight line from the population-weighted centre of each census area to the nearest way into a mapped public park. On that measure 49.7% of residents are within 300 m, and five other ways of counting give between 37.1% and 66.5%. The map tests how near a park is, so it doesn't measure the walk, the quality of the park or other green space.
More maps from the #30DayMapChallenge: coming soon, in Moxi's map journal.
You could ask for a map of your own area, or one drawn from your own data.
OKF-Loom v2 is an open-source tool, under the Apache-2.0 licence, that anyone can use to help with their documentation. If you're writing specs or other documentation for clients, it lets those clients interact with what you've written.
It's a fork of okf-loom v1, which ojamin created and wrote.
Tell me what you're trying to find out, what data you have and whether there's a deadline. I'll reply by email, and we'd have a first conversation before I quote for anything.